


OnlyRank

Case studies

What actually happened, told step by step

Real engagements, with the starting point, the work, and the result, in order, plus live tracking snapshots for accounts still in progress. Where a figure is illustrative rather than confirmed, we say so.

  • CircleDNA
  • Mil Design
  • TigerCampus
  • Darlie
  • MonstarX
CircleDNA logo

CircleDNA

Source: SEMrush · 6-month engagement

Organic traffic 50k → 150k sessions/mo (+200%)

  1. 1

    Starting point

    50,000 organic sessions a month. Only 1 of 10 target keywords ranking in the top 10. No structured tracking of AI citations yet.

  2. 2

    What we did

    Started AEO citation tracking and a schema audit. Shipped FAQ and product schema. Rewrote key pages answer-first, matching the YMYL-grade E-E-A-T bar health claims require.

  3. 3

    Three months in

    Illustrative ramp, to be replaced with a live SEMrush export. Keywords in the top 10 climbed to 4 of 10 as the schema and rewrites took hold, and the first AI citations started appearing.

  4. 4

    Six months in

    Confirmed. Traffic hit 150,000 sessions a month, 3x the baseline. 7 of 10 target keywords now rank page one, with page-one rankings and AI citations landing together.
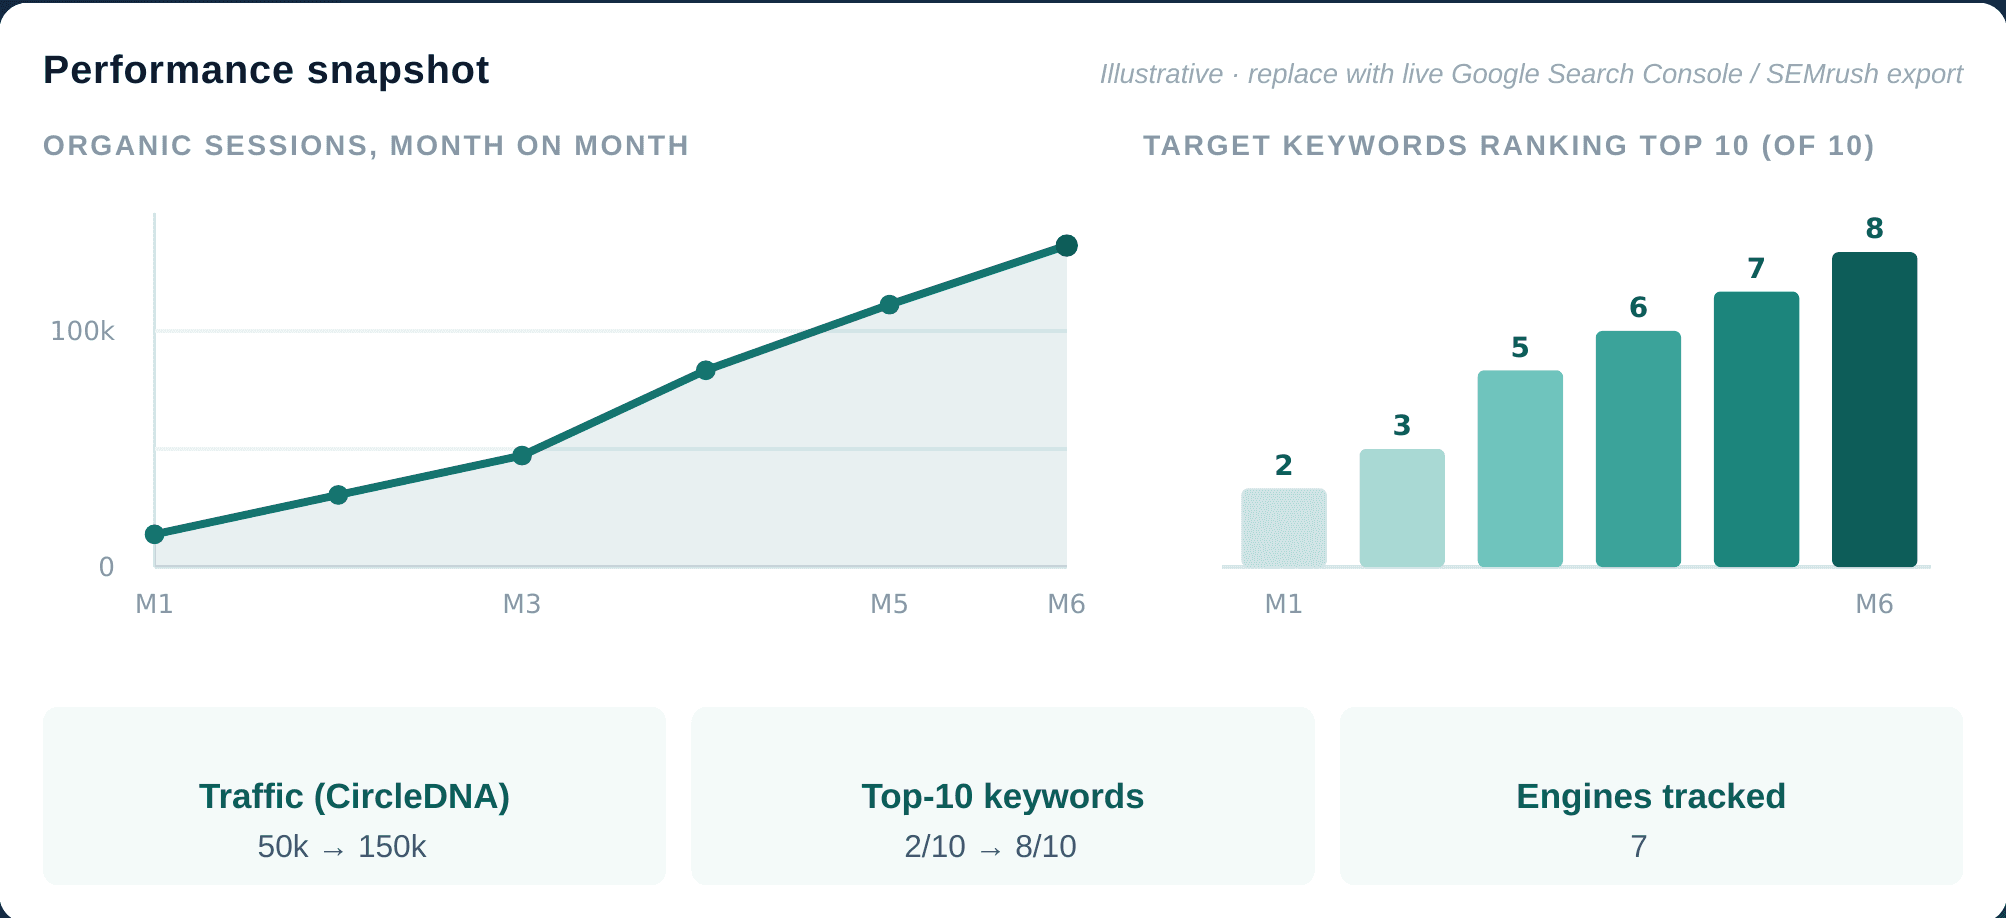
CircleDNA performance snapshot: organic sessions climbing from near 0 to over 100k over 6 months, and target keywords ranking top 10 rising from 2 to 8 of 10.
From the Cloudline Studio delivery blueprint. Illustrative shape, replace with a live Search Console/SEMrush export.
Mil Design logo

Mil Design

Source: Google Search Console · Ongoing since March 2025

Search impressions up 195%, still climbing

  1. 1

    Starting point (April 2025)

    1.73K search impressions, 78 clicks, 4.5% CTR, average position 33.4: a tight footprint, converting well but almost entirely on brand-name searches.

  2. 2

    What we did

    Continuous on-page and content optimisation, expanding coverage from brand terms into the non-brand interior-design category.

  3. 3

    Where it stands now (~15 months in)

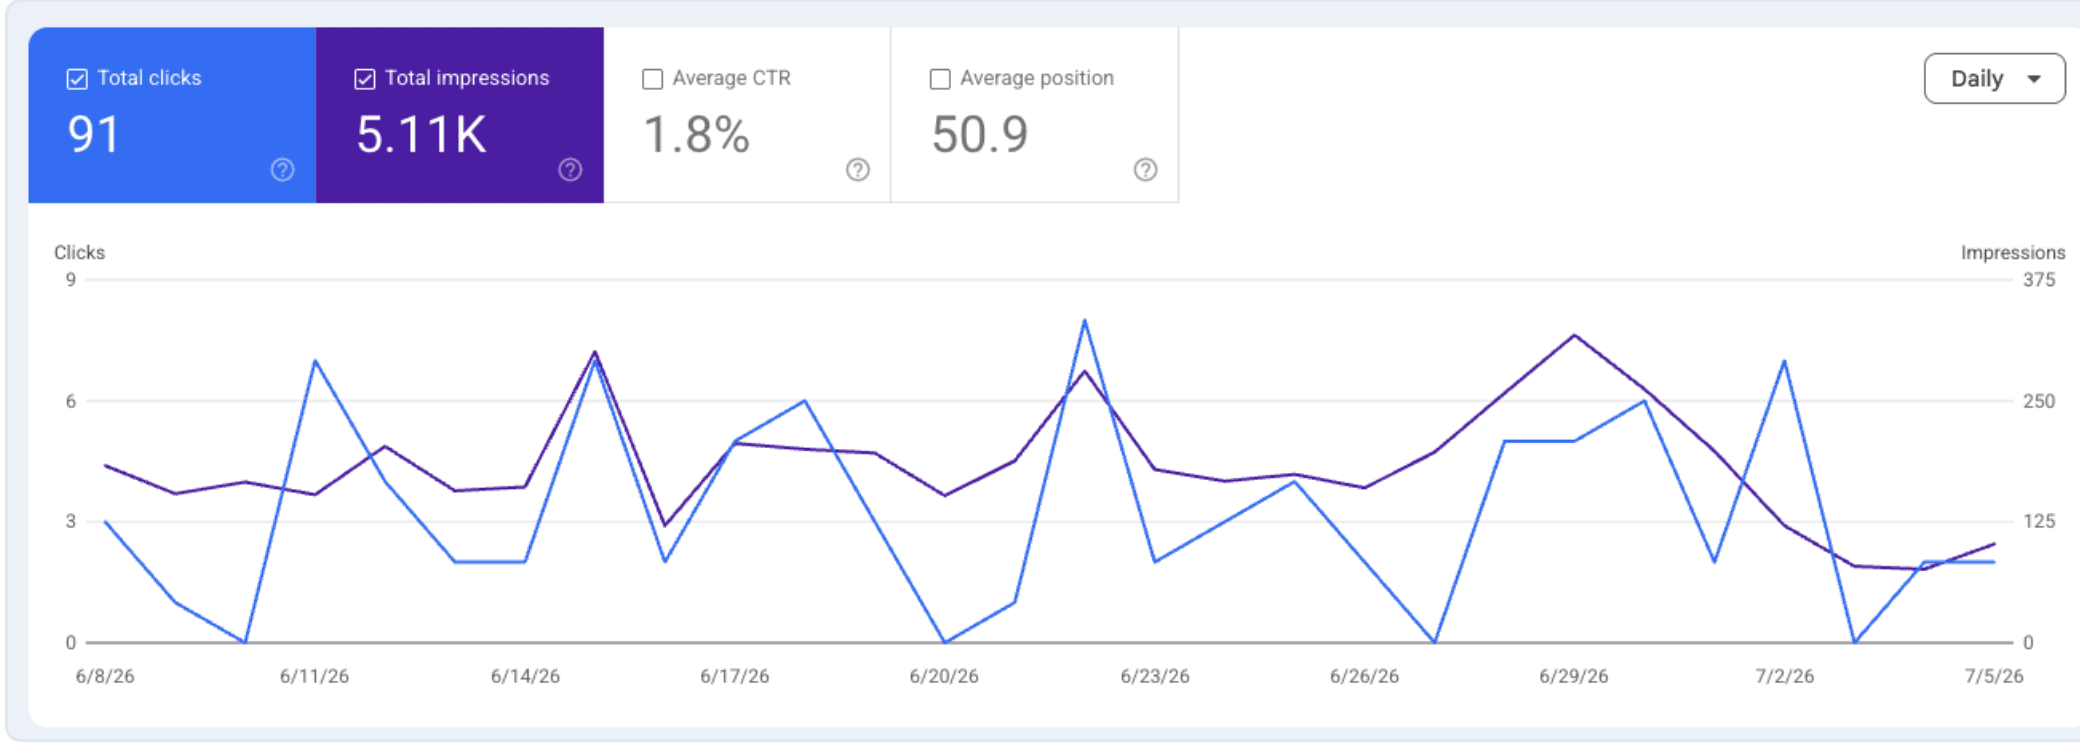
    Impressions up 195% to 5.11K, clicks up to 91. CTR settled to 1.8% and average position moved to 50.9, both pulled down by new non-brand terms now appearing in search (“interior design malaysia” at 191 impressions, “commercial interior design malaysia” at 242) that haven't reached page one yet.

  4. 4

    What's next

    Converting that newly-won non-brand visibility into clicks is the active target for the next phase. Presented honestly as in-progress, not a finished win.

  5. 5

    Latest month (June → July 2025)

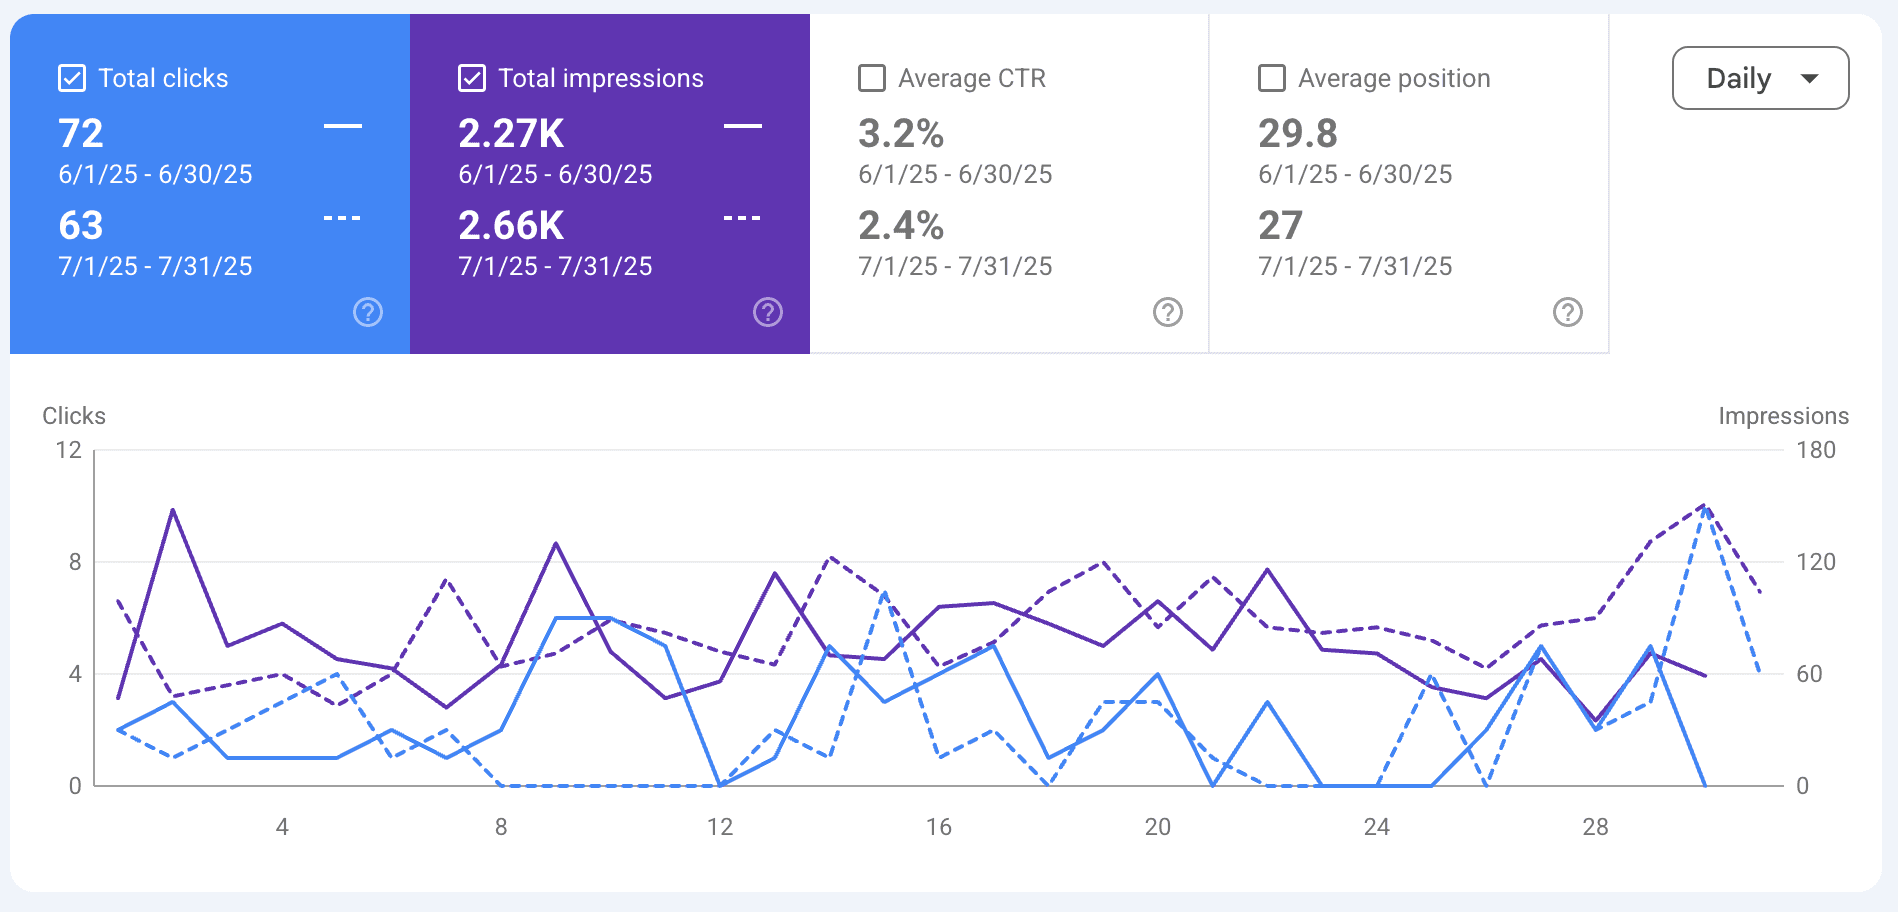
    Impressions kept climbing, 2.27K to 2.66K, and average position improved from 29.8 to 27. Clicks and CTR dipped slightly (72 → 63 clicks, 3.2% → 2.4% CTR) as that broader set of non-brand terms is still maturing.

Mil Design's real Google Search Console dashboard, now: 91 clicks, 5.11K impressions, 1.8% CTR, average position 50.9.
Jul 2026, ~15 months in
Mil Design's real Google Search Console monthly comparison: June 2025 (72 clicks, 2.27K impressions, position 29.8) vs. July 2025 (63 clicks, 2.66K impressions, position 27).
June vs. July 2025
TigerCampus logo

TigerCampus

Source: Google Search Console · Same 28-day period, year over year

848K impressions with continuous SEO; -83% within weeks of pausing

  1. 1

    With continuous SEO running

    848K impressions, 1.11K clicks, average position 7.1: page one, the peak visibility point during active engagement.

  2. 2

    The engagement paused

    Cloudline's SEO work stopped.

  3. 3

    The same 28-day window, after the pause

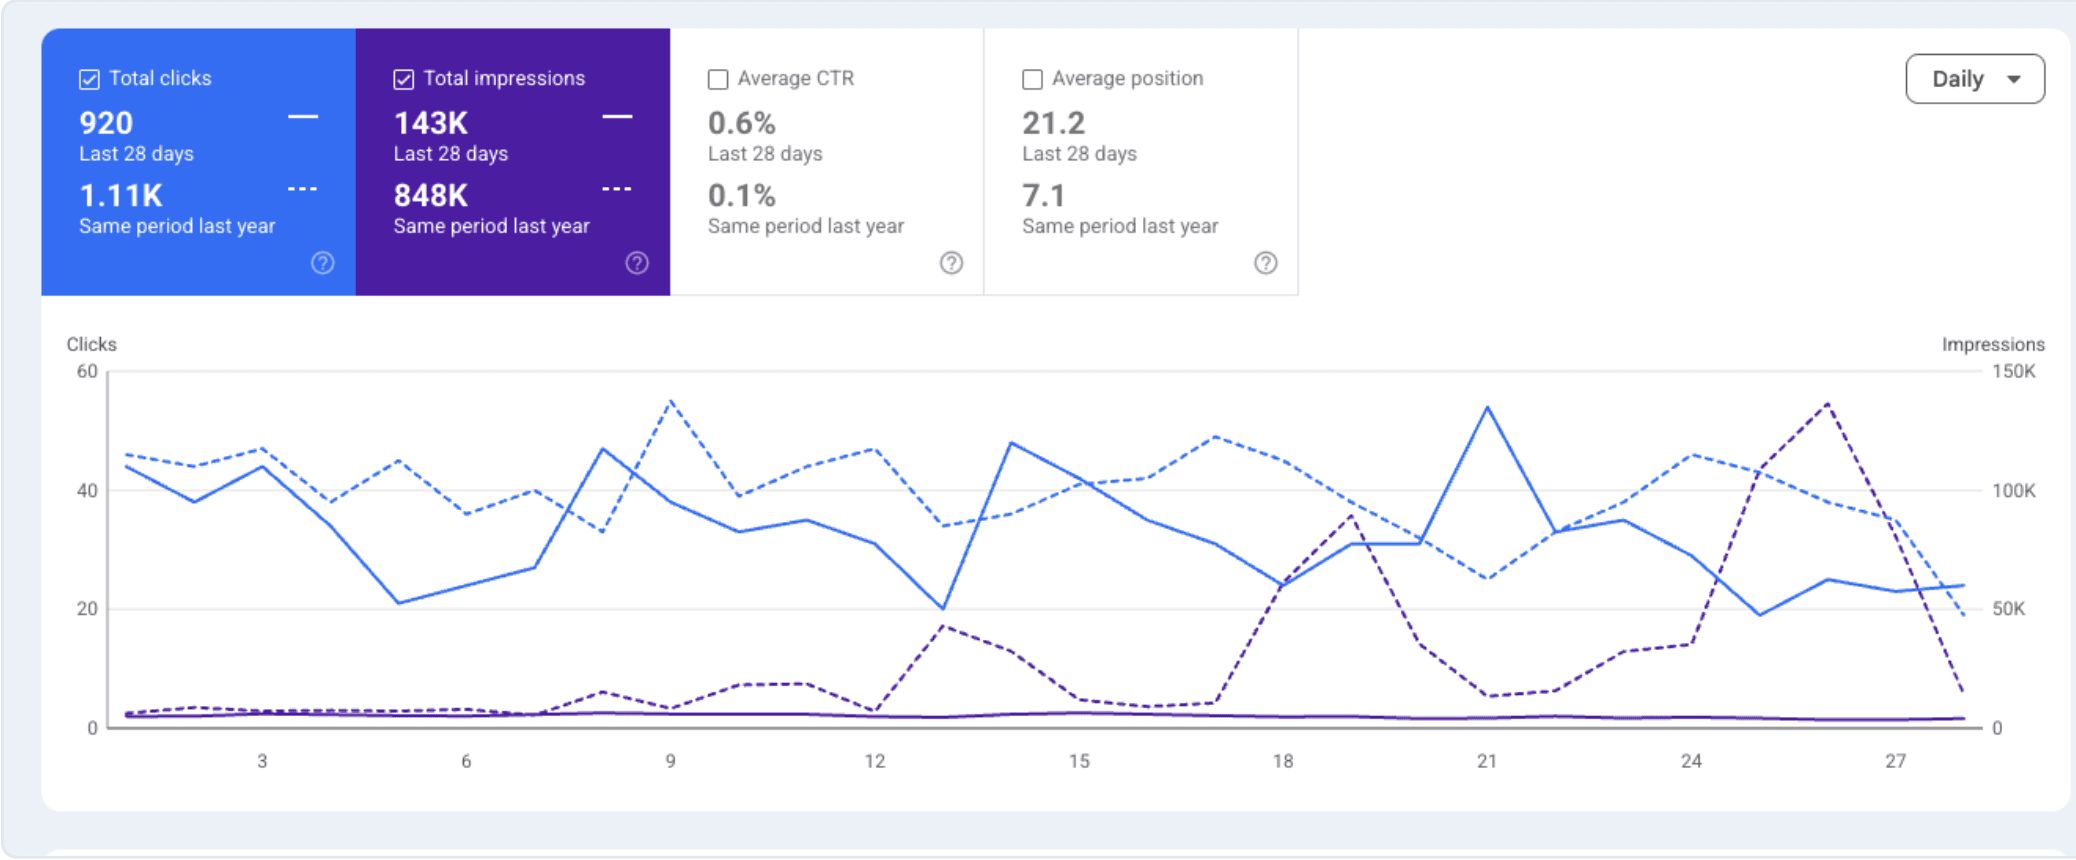
    Impressions fell 83% to 143K, clicks dropped to 920, and average position slipped from 7.1 to 21.2.

  4. 4

    The takeaway

    Visibility built over a year eroded within weeks once the work stopped: the real-world case for running SEO as a continuous programme, not a one-off project.

TigerCampus's real Google Search Console dashboard comparing the same 28-day period year over year: 920 clicks/143K impressions now vs. 1.11K clicks/848K impressions the same period last year.
Same 28-day period, year over year
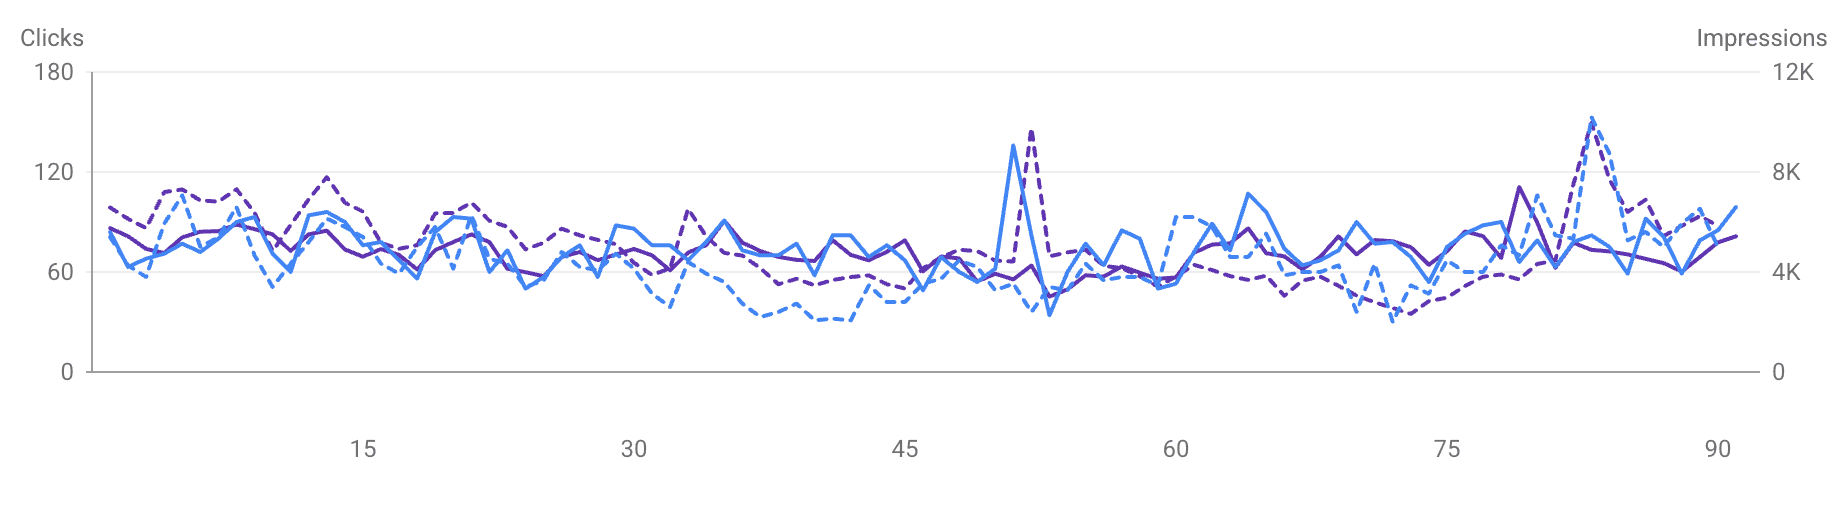
TigerCampus's real Google Search Console 90-day clicks and impressions trend, continuing to track visibility.
90-day tracking view
MonstarX logo

MonstarX

Source: Google Search Console · Last 3 months vs. previous 3 months

Now cited by name in Google AI Overviews for head-to-head comparisons

  1. 1

    Starting point

    An enterprise AI app-builder platform with a steady but modest footprint: ~355 clicks and 1.78K impressions a month, holding a page-one average position around 6.3. Almost no presence in AI-generated answers when buyers compared MonstarX against competitors like Lovable and Bolt.

  2. 2

    What we did

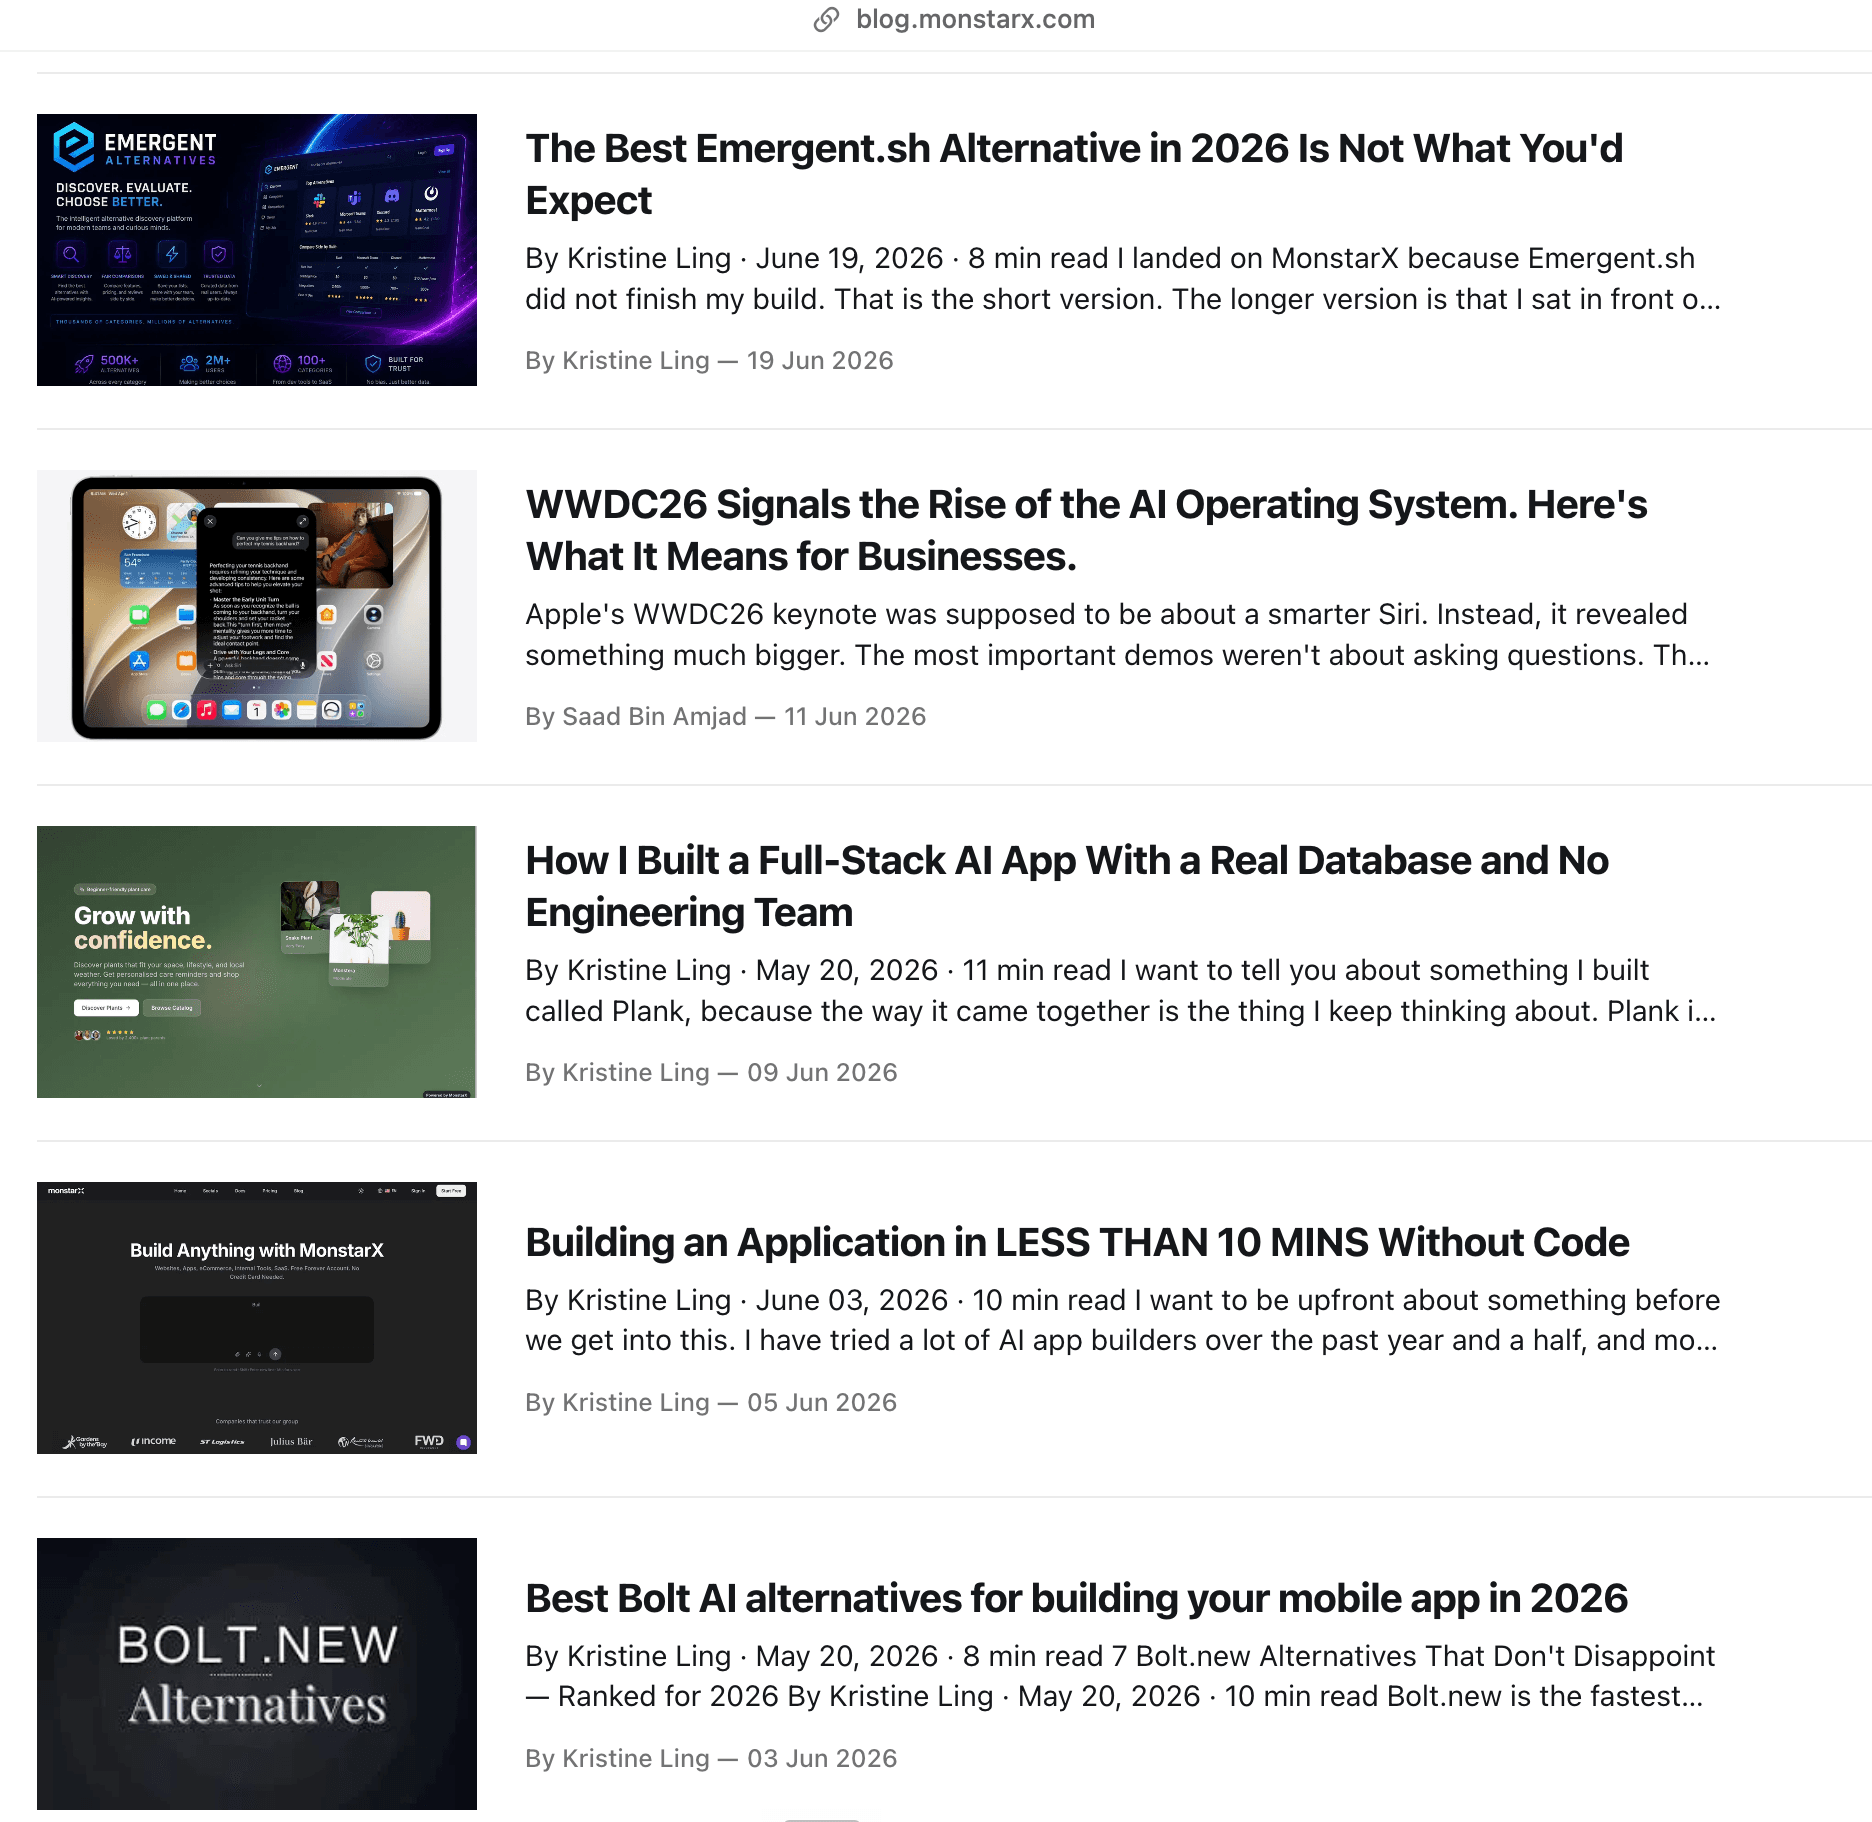
    Automated MonstarX's blog publishing pipeline, rebuilt their entire landing page structure, and rewrote the page to focus on driving sign-ups instead of just describing the product.

  3. 3

    Results (Google Search Console)

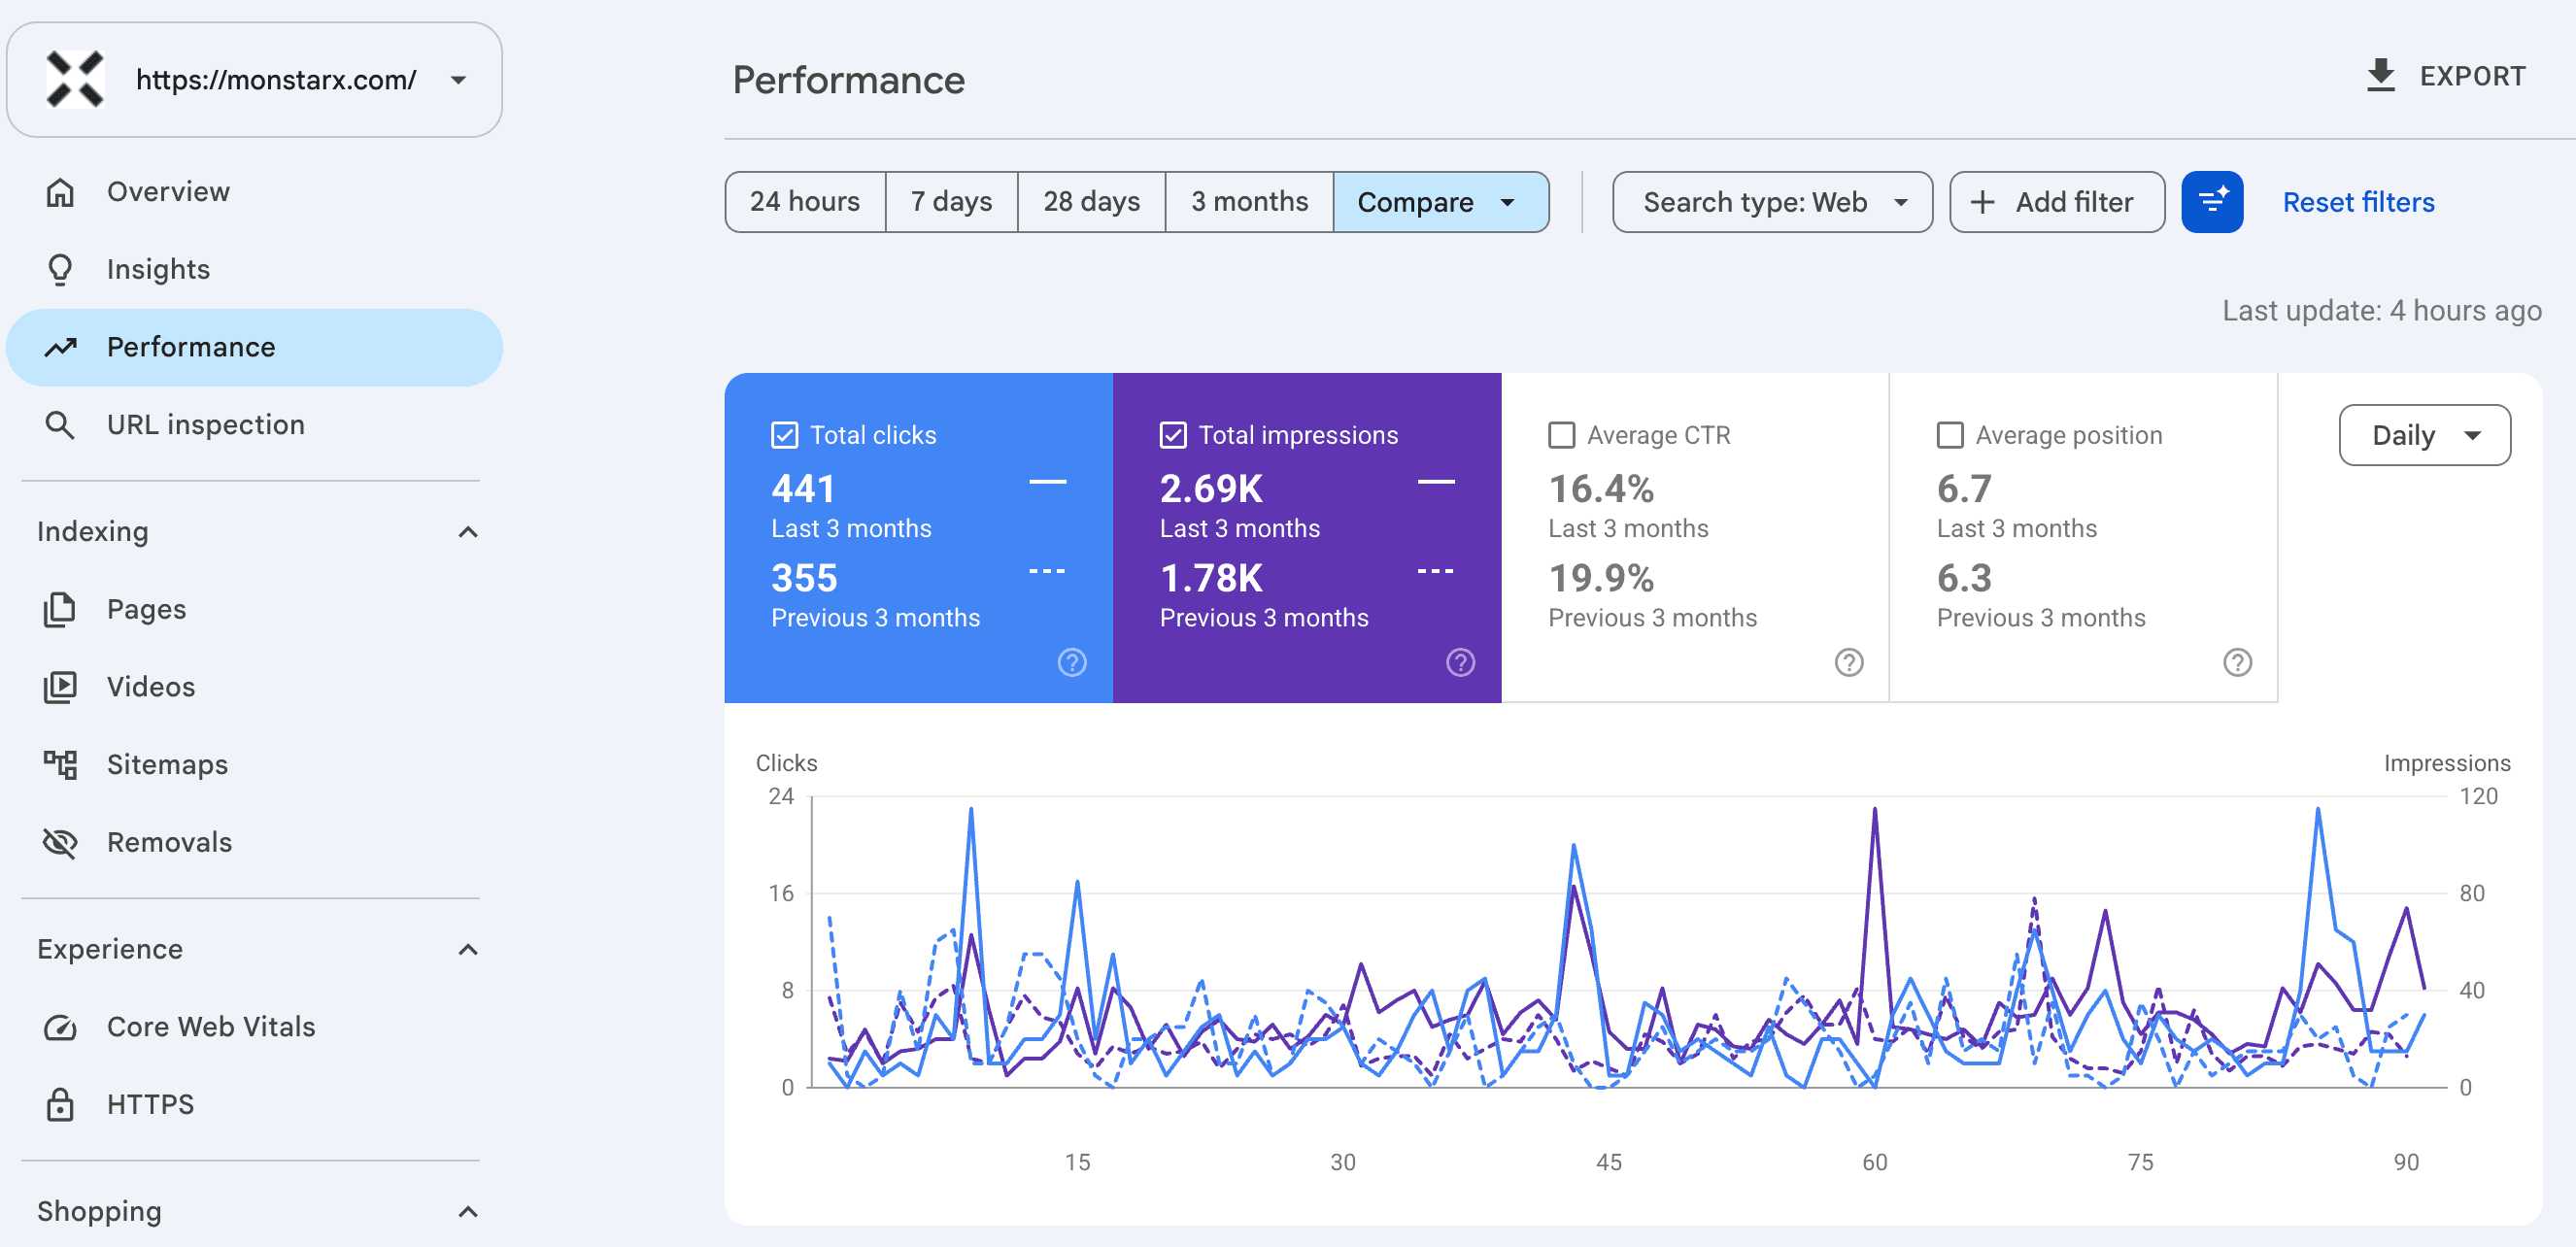
    Clicks grew 24% (355 to 441) and impressions grew 51% (1.78K to 2.69K) quarter over quarter, holding a strong page-one average position around 6 to 7.

  4. 4

    Cited by AI

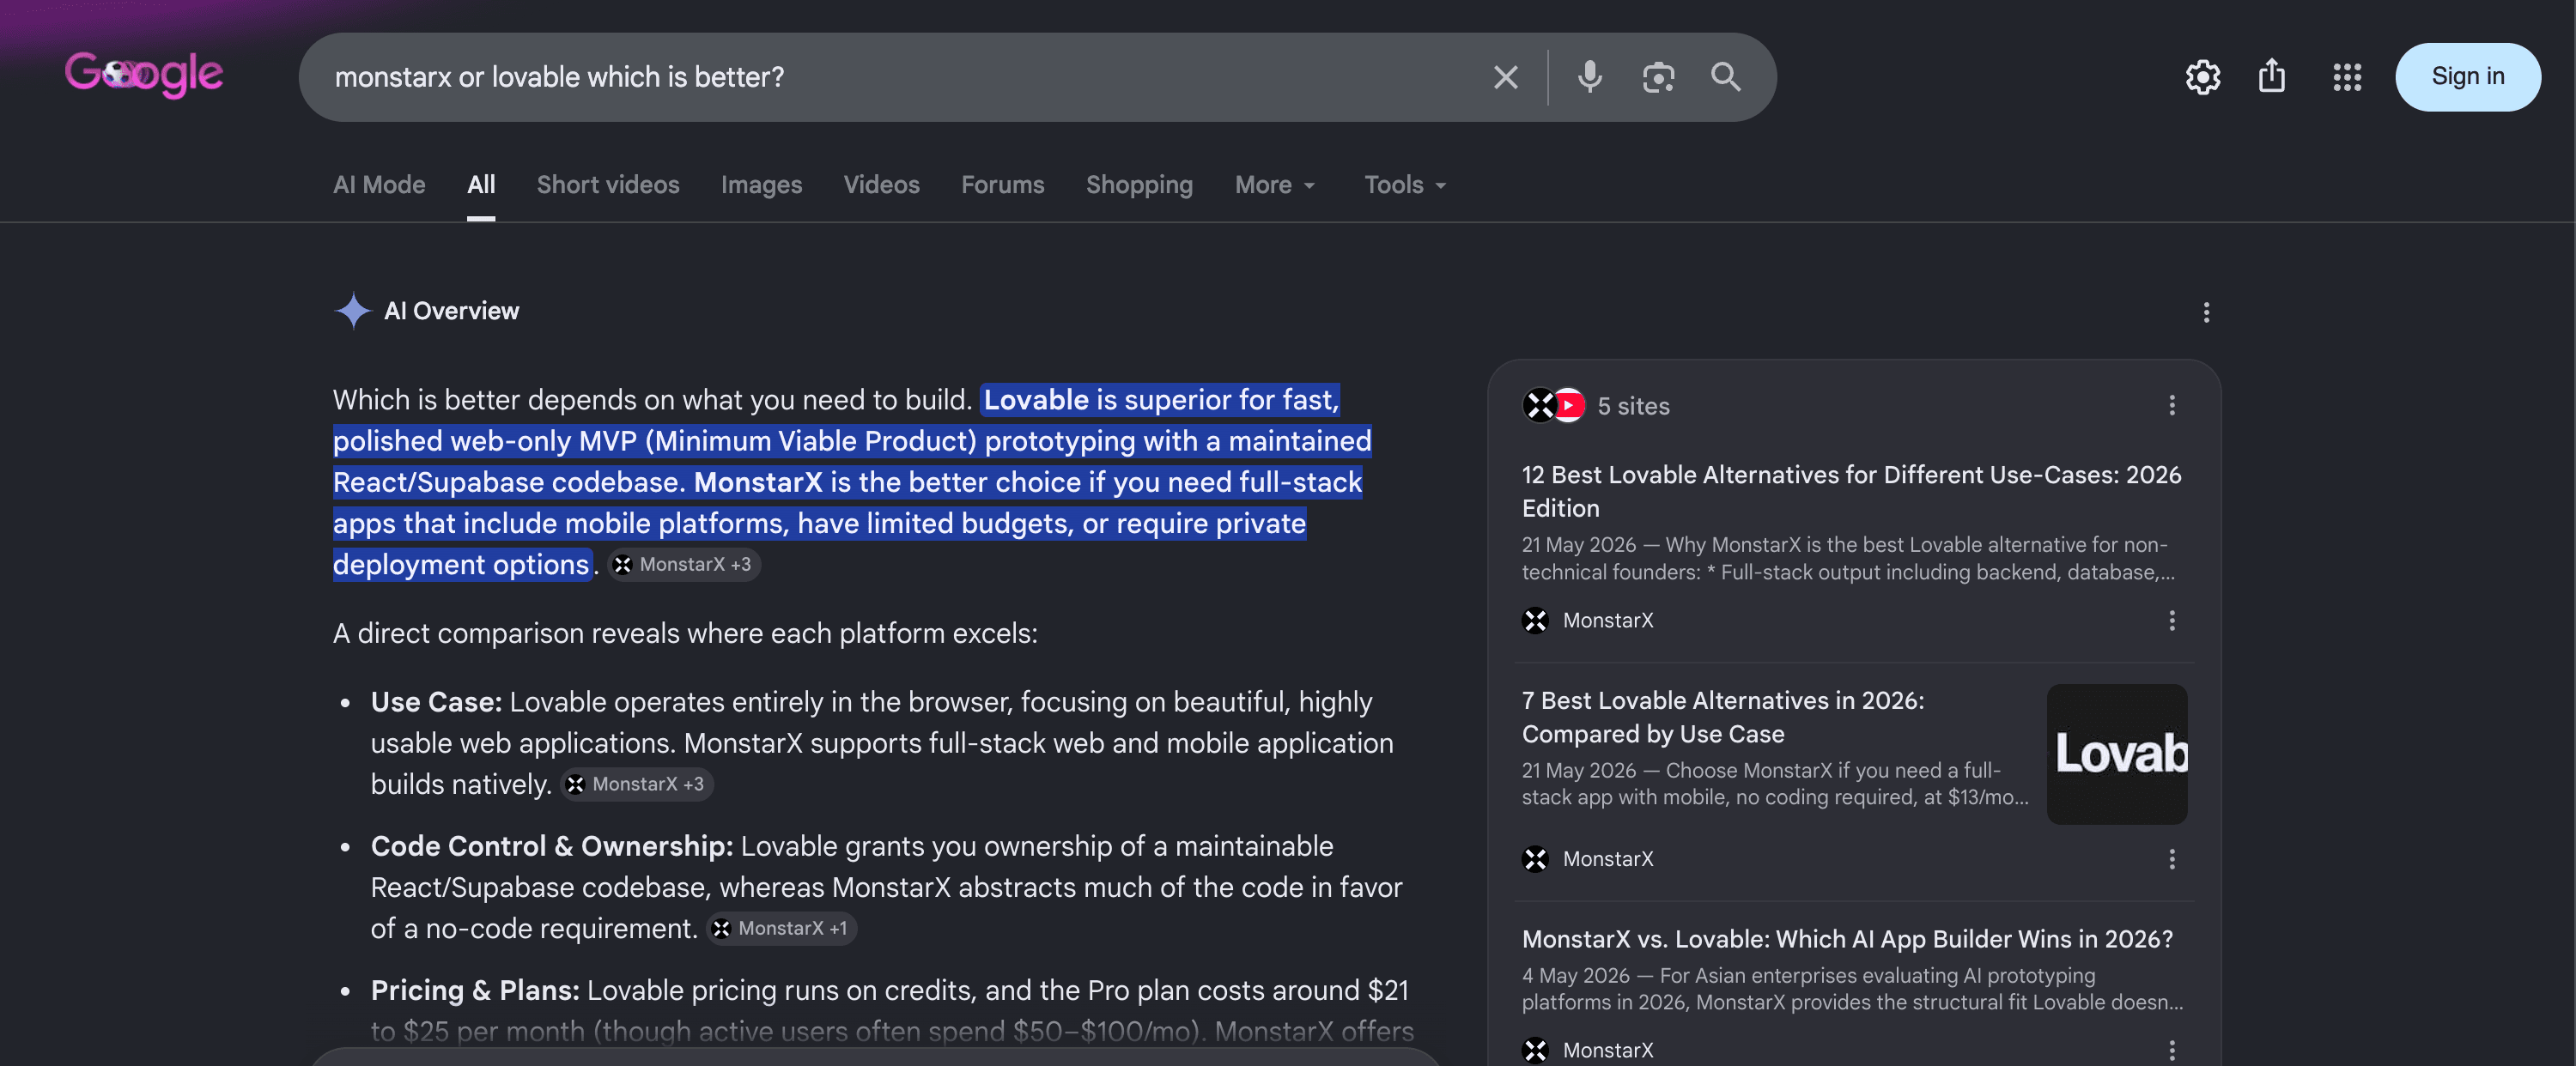
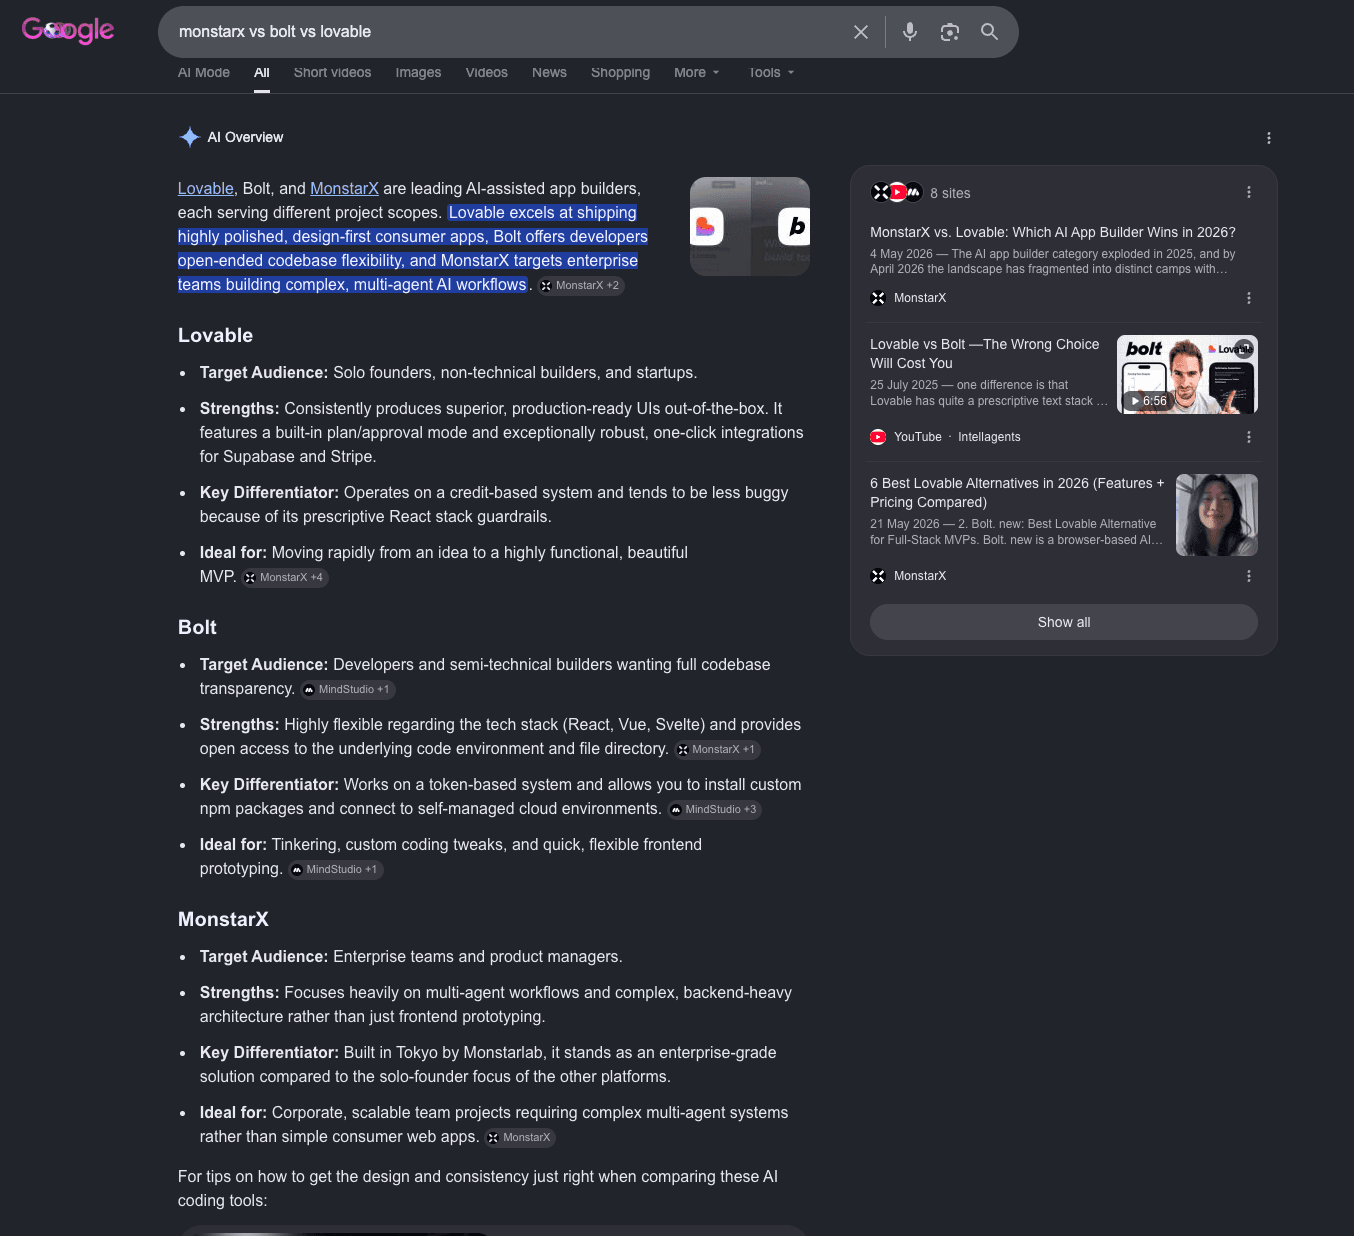
    MonstarX now shows up by name in Google AI Overviews for exactly the comparison questions buyers ask. Real AI Overviews for “MonstarX or Lovable, which is better?” and “MonstarX vs Bolt vs Lovable” both cite MonstarX directly, with a breakdown of where it fits.

  5. 5

    What's next

    A full before/after of the landing page redesign is coming once that work is documented.

MonstarX's real Google Search Console dashboard: 441 clicks and 2.69K impressions in the last 3 months, up from 355 clicks and 1.78K impressions the previous 3 months.
Last 3 months vs. previous 3 months
Real Google AI Overview for the search “monstarx or lovable which is better?”, recommending MonstarX for full-stack apps with mobile platforms, limited budgets, or private deployment needs.
Real Google AI Overview · “monstarx or lovable which is better?”
Real Google AI Overview for the search “monstarx vs bolt vs lovable”, with a dedicated MonstarX section covering target audience, strengths, and ideal use case.
Real Google AI Overview · “monstarx vs bolt vs lovable”
MonstarX's real blog (blog.monstarx.com), showing the automated publishing pipeline in production.
Real screenshot · blog.monstarx.com, automated publishing pipeline
Darlie logo

Darlie

Source: SEMrush · 2020–2022 engagement

Traffic +55% within 3 months of a technical reset

  1. 1

    Starting point (March)

    Roughly 6.2K monthly visits. Core Web Vitals had just launched as a Google ranking signal and mobile page experience was rolling out industry-wide: the technical bar was rising, and the site wasn't ready for it.

  2. 2

    What we did

    Built the technical SEO foundation: Core Web Vitals fixes, mobile optimisation, indexation cleanup, and brand-term coverage.

  3. 3

    April

    Visits rose to roughly 6.5K (+5%) as brand-term coverage and the first technical wins started registering.

  4. 4

    May

    Traffic broke out to 9.6K visits, +55% versus March, as the speed and indexation work compounded.

  5. 5

    Why it still matters

    This work predates the AI-search era, but it's the same technical foundation later AEO work for other clients builds on: get the technical layer right first, then layer content authority and AI-citation work on top.

  6. 6

    Current tracking

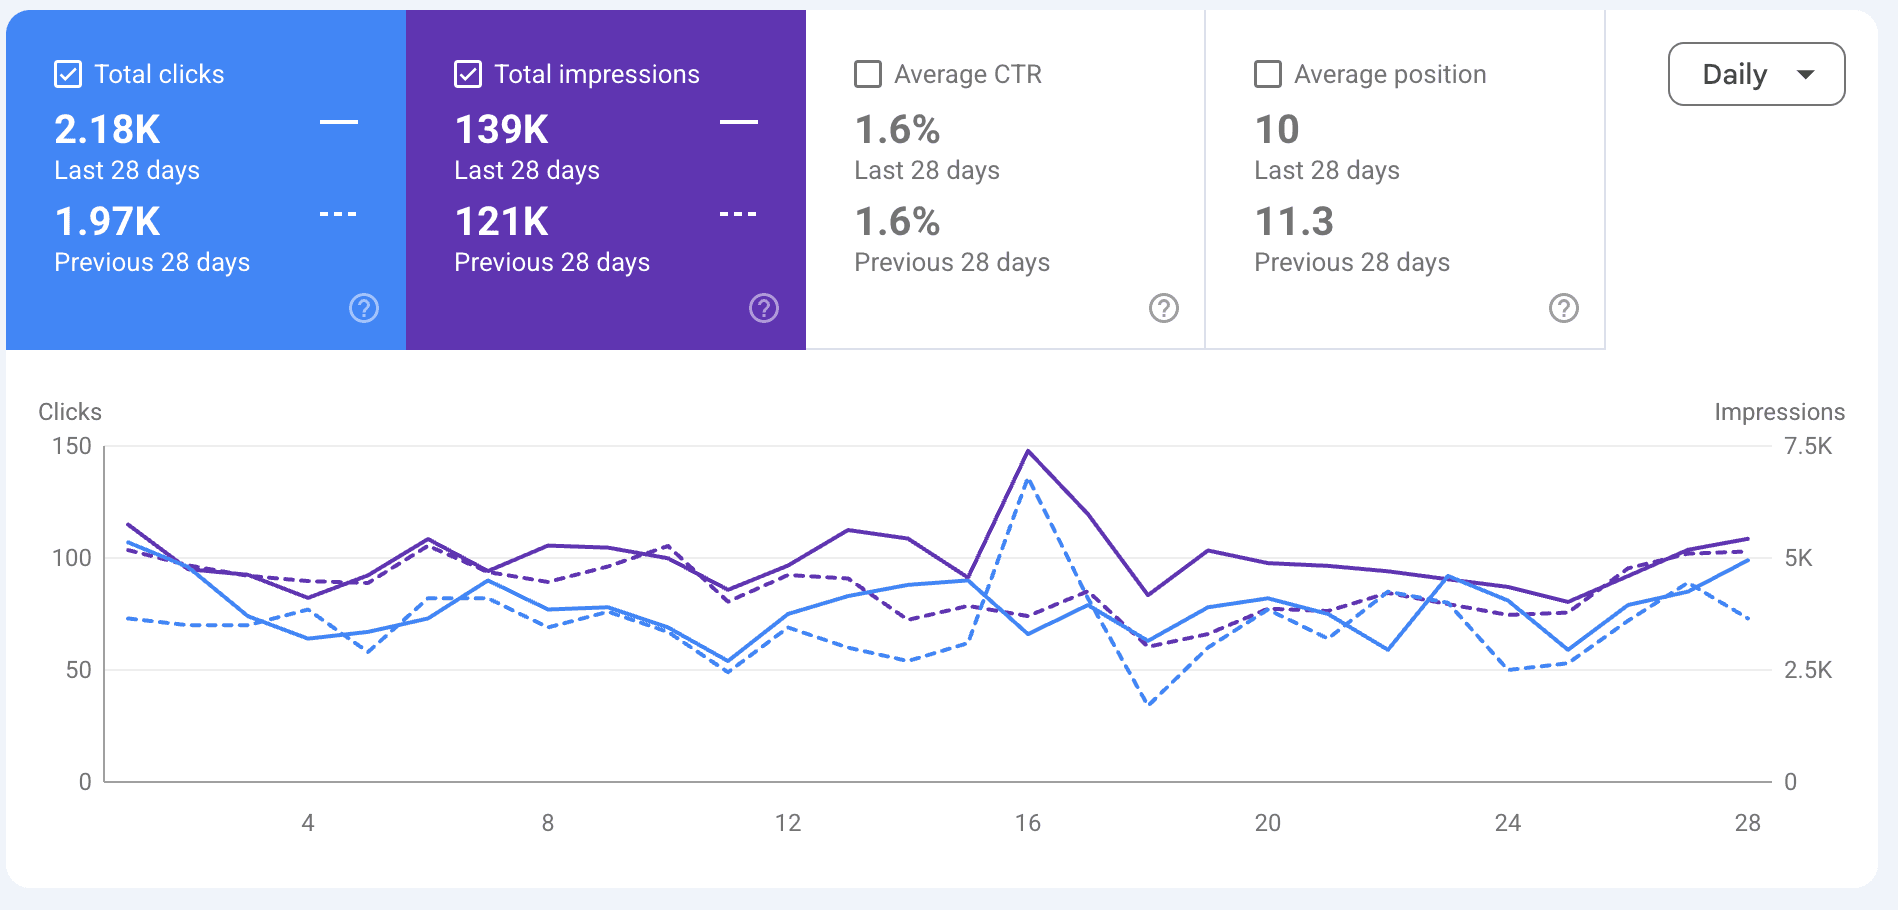
    Google Search Console, last 28 days: 2.18K clicks and 139K impressions, up from 1.97K clicks and 121K impressions the prior 28 days. Average position improved to 10 from 11.3. The foundation built in 2020–2022 is still compounding.

Darlie's real Google Search Console dashboard: 2.18K clicks and 139K impressions in the last 28 days, up from 1.97K clicks and 121K impressions the prior 28 days, average position improved to 10 from 11.3.
Current 28-day tracking

Tracked live

More real accounts, updated as they move

Full process narratives above; these are live Google Search Console snapshots for accounts we haven't written up in full yet. Real numbers, shown as-is.

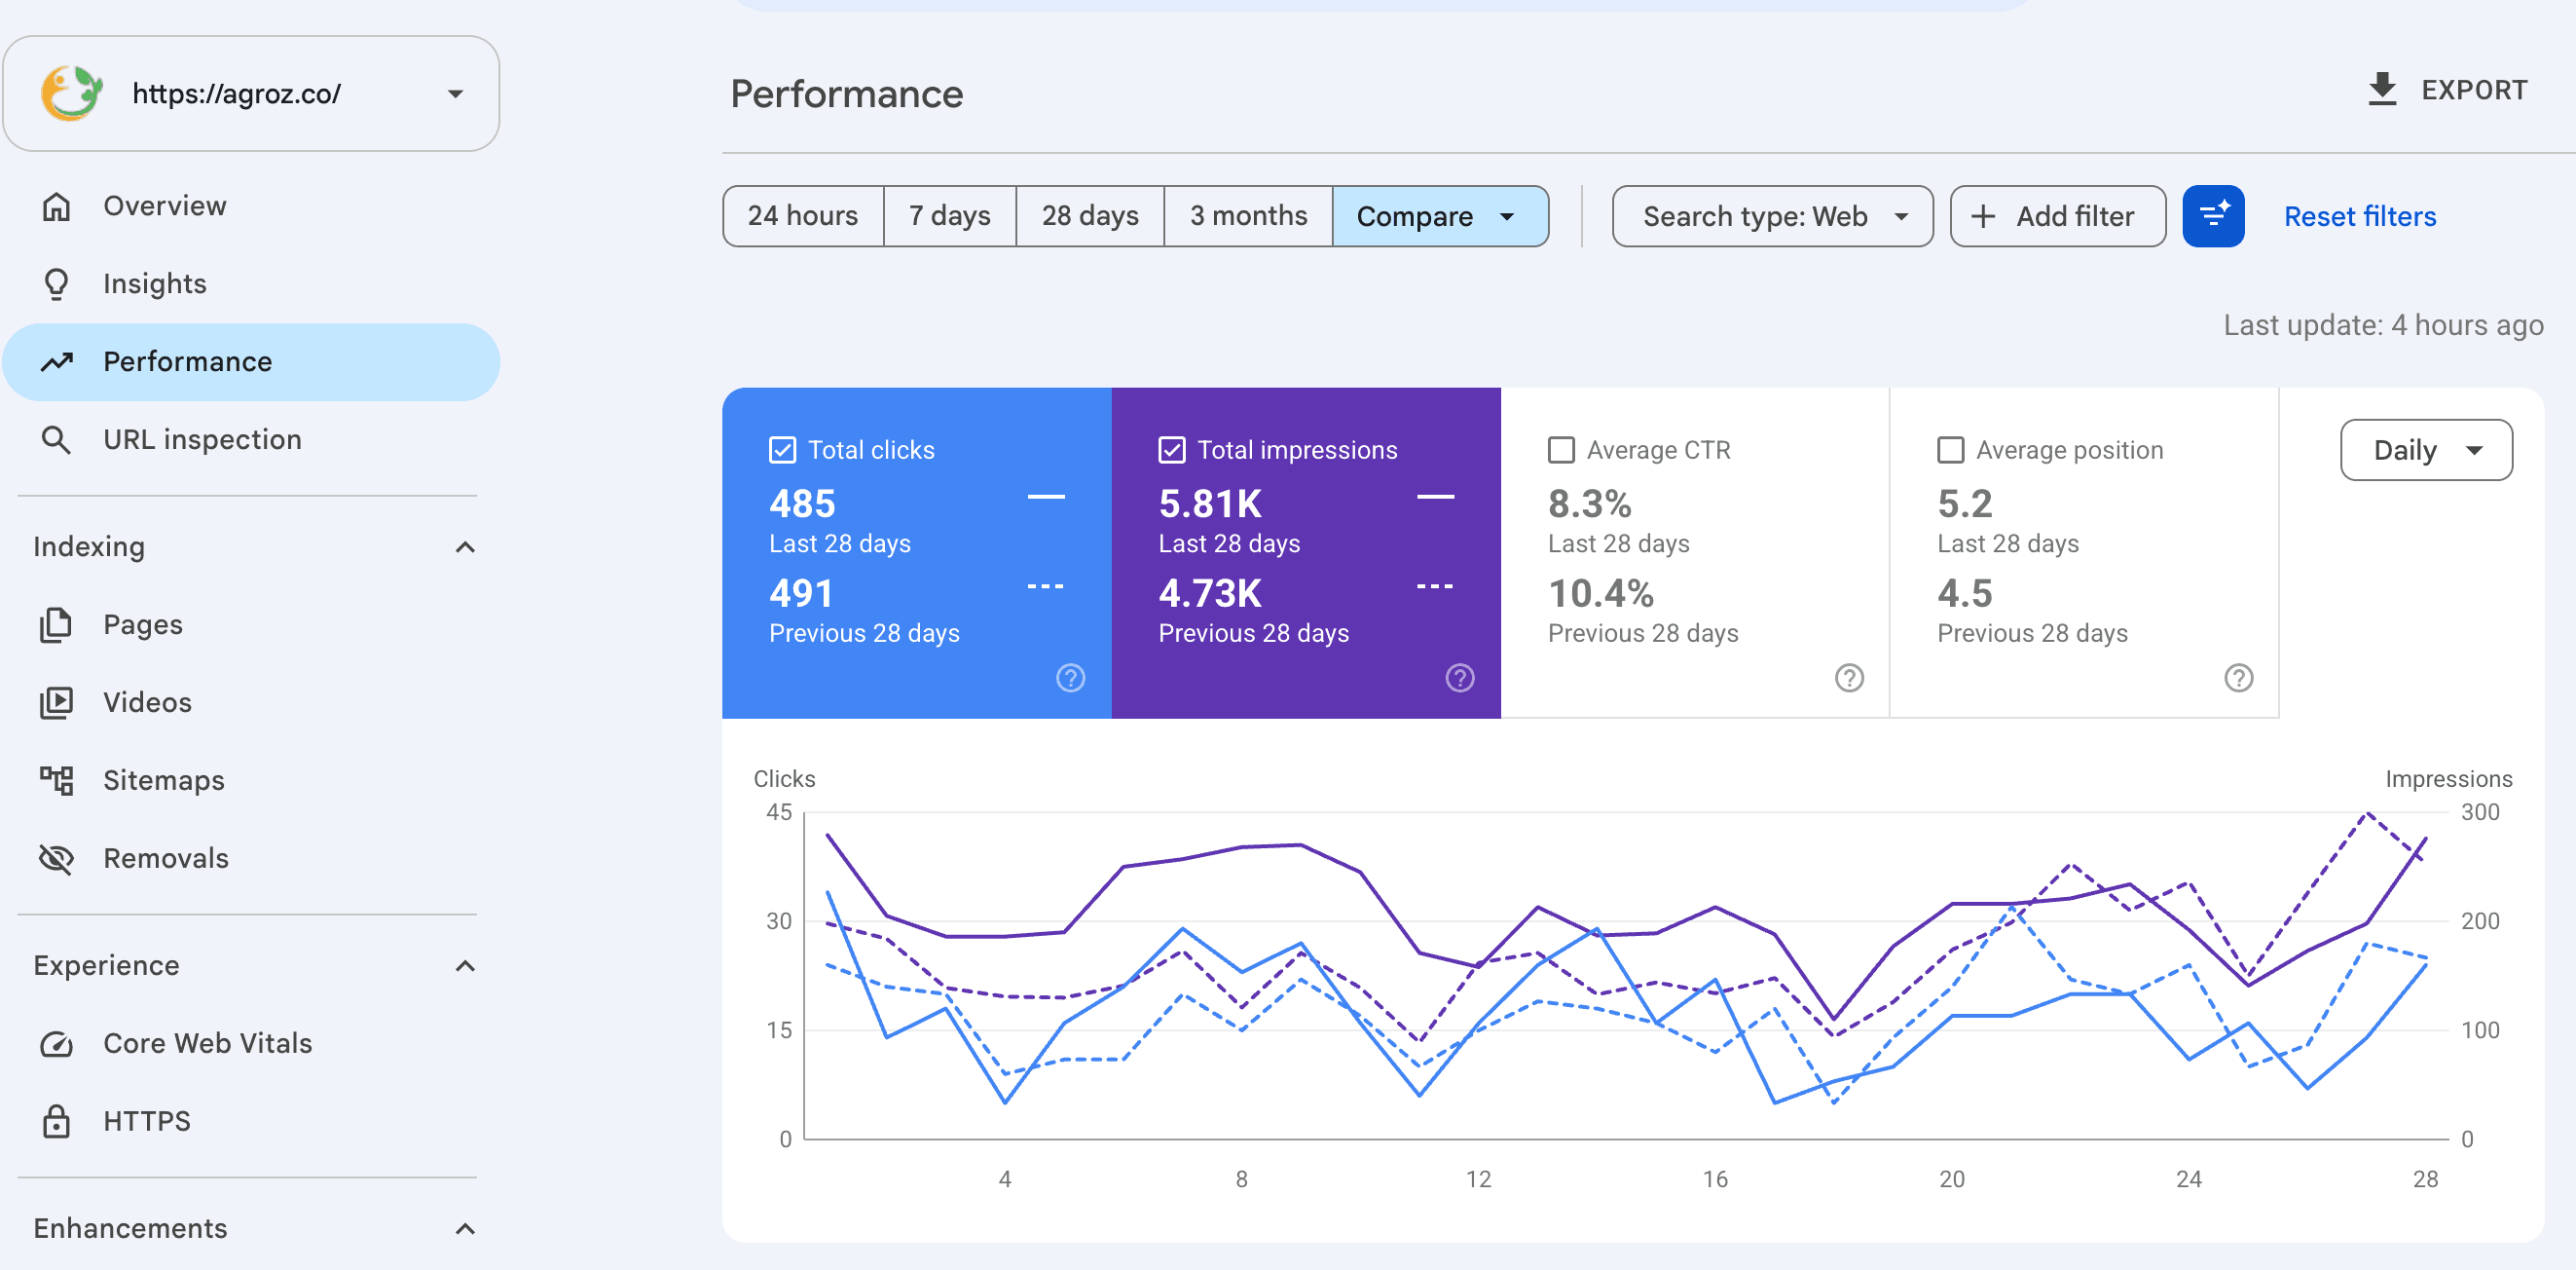
Agroz's real Google Search Console dashboard, last 28 days vs. previous 28 days.
A

Agroz

agroz.co

Google Search Console · Last 28 days vs. previous 28 days

Clicks
485 (was 491)
Impressions
5.81K (was 4.73K)
CTR
8.3% (was 10.4%)
Avg. position
5.2 (was 4.5)

Impressions grew as reach expanded, holding a strong page-one average position in the 5 range.

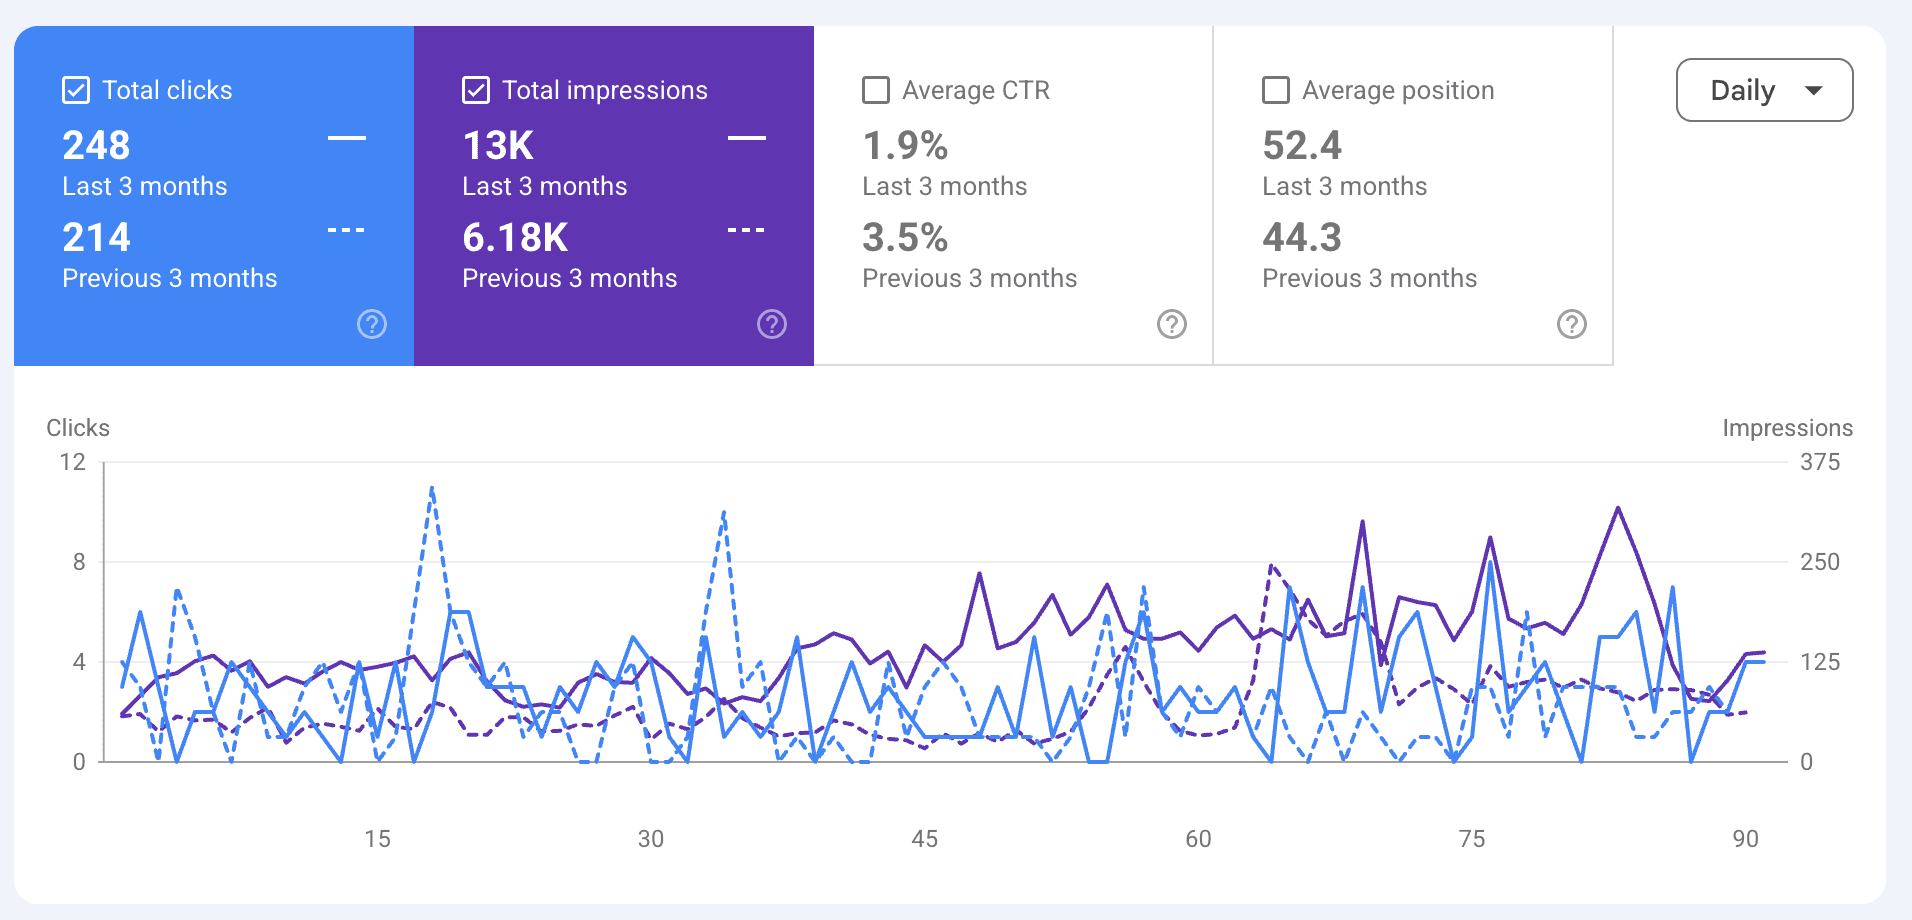
Prouvers Sdn. Bhd's real Google Search Console dashboard, last 3 months vs. previous 3 months.
PS

Prouvers Sdn. Bhd

Google Search Console · Last 3 months vs. previous 3 months

Clicks
248 (was 214)
Impressions
13K (was 6.18K)
CTR
1.9% (was 3.5%)
Avg. position
52.4 (was 44.3)

Impressions more than doubled as visibility expanded into new queries, though average position and CTR softened while that broader set of terms matures, presented honestly as in-progress.

Industry benchmarks

What's possible, documented elsewhere

These are external benchmarks, not Cloudline Studio client results. Each row is credited to the publisher that originally reported it.

Company / nicheResultWindowSource
Outbuild (B2B SaaS)~3x traffic (3,653 → 10,853/mo)~12 monthsPosition Digital
HR Datahub (B2B SaaS)+315% traffic, keywords 8 → 89~8 monthsPosition Digital
Decentriq (B2B SaaS)+106% monthly organic traffic~10 monthsPosition Digital
Phonexa (martech)+34% demos (traffic -13%)CampaignPosition Digital
Smart-home e-commerce+300% traffic; domain authority 32 → 4190 daysACSIUS
Affiliate site+1,367% (920 → 13,503/mo)CampaignSearch Logistics
Cleaning services (local)+89% conversions, +45% traffic~8 monthsLocal Dominator
Local service business+220% organic leads9 monthsBrandstory
B2B software (clusters)+180% traffic12 monthsBrandstory
Broworks (B2B tech, AEO)10% visits from AI, 27% to SQL90 daysvia Stackmatix
Zapier (AEO tutorials)+25% AI-referred signups6 monthsvia Gray Group

Want results like these?

Get a free audit and we'll tell you honestly what's achievable for your niche and timeline.

Get my free audit